Plot spawning biomass
plot_biomass_spawning.RdPlot spawning biomass or relative spawning biomass by year for one or more model runs.
Usage
plot_biomass_spawning(
  data_list,
  object_list = NULL,
  relative = TRUE,
  labels = NULL,
  units = "model units",
  scale = 1
)
Arguments
- data_list
An Opal object, list of Opal objects, or list of model data lists.
- object_list
Omit for Opal objects. For legacy calls, a list of RTMB objectives.
- relative
Logical; plot spawning biomass relative to unfished biomass.
- labels
Optional labels for the model runs.
- units
Label for absolute spawning output. Fecundity-based spawning output is not necessarily biomass; defaults to
"model units".- scale
Positive divisor for absolute spawning output, default one.
Examples
assessment <- opal_read(system.file("extdata", "opaka_quickstart_fit.rds",
                                   package = "opal"))
#> Warning: The saved fit runtime identity differs because it was serialized under a different R version; verifying by rebuild.
#> Warning: The saved fit runtime identity differs because it was serialized under a different R version; verifying by rebuild.
#> Warning: The opal_model implementation checksum differs from the saved fit. The saved fit used opal 0.0.4; the current version is 0.1.1.
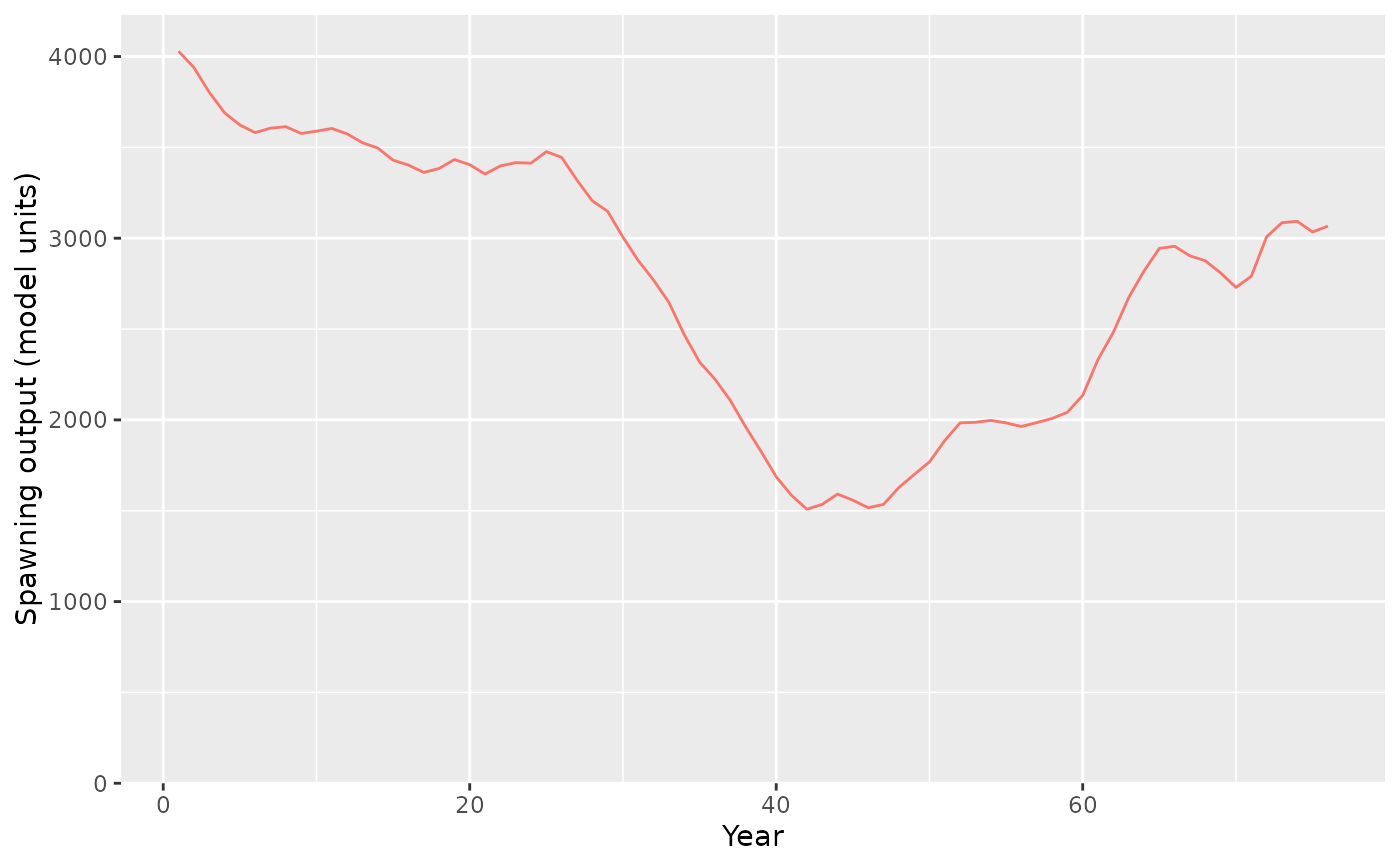
plot_biomass_spawning(assessment, relative = FALSE, labels = "Baseline")
#> Warning: The model implementation checksum differs from the saved object.
#> Warning: The model implementation checksum differs from the saved object.
#> Warning: The model implementation checksum differs from the saved object.